75+ Human Resources statistics to guide your tech hiring in 2019

2019 is around the corner and it’s time for us to take a look at all the most recent tech recruitment research. To help you make the best hiring decisions throughout 2019, we’re giving you 75 human resources statistics. The data gathered here can give you a good snapshot of the state of hiring at the end of 2018.
We’ve gone through volumes of research by industry leaders including Stack Overflow, The Bureau of Labor Statistics, LinkedIn, Deloitte, ManpowerGroup, Glassdoor, Gallup, Jobvite, iCIMS Inc., NFIB, Sentier Research, USA Today, PayScale, and Thomson Reuters.
Without further ado, let’s dive right into the Human Resources statistics for 2019!
Human Resources statistics for 2019
Talent shortage human resources statistics
1. 67% of recruiters see the lack of skilled and high-quality candidates as the biggest challenge in hiring. (Jobvite)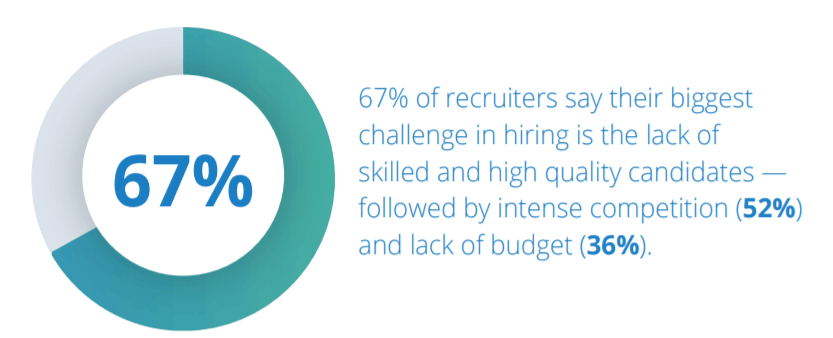
2. It’s becoming increasingly difficult to fill open positions and the global talent shortage is at a 12-year high. (ManpowerGroup)
3. Based on ManpowerGroup data, 45% of employers globally report they cannot “find the skills they need, up from 40% in 2017 and the highest in over a decade.” (ManpowerGroup)
4. According to Jobvite, “The average number of applicants per open requisition has declined: from 59 (2015) to 52 (2016) to 36 (2017).” (Jobvite).
5. A job opening attracts on average 250 applications. (ERE)
Key HR trends to impact 2019
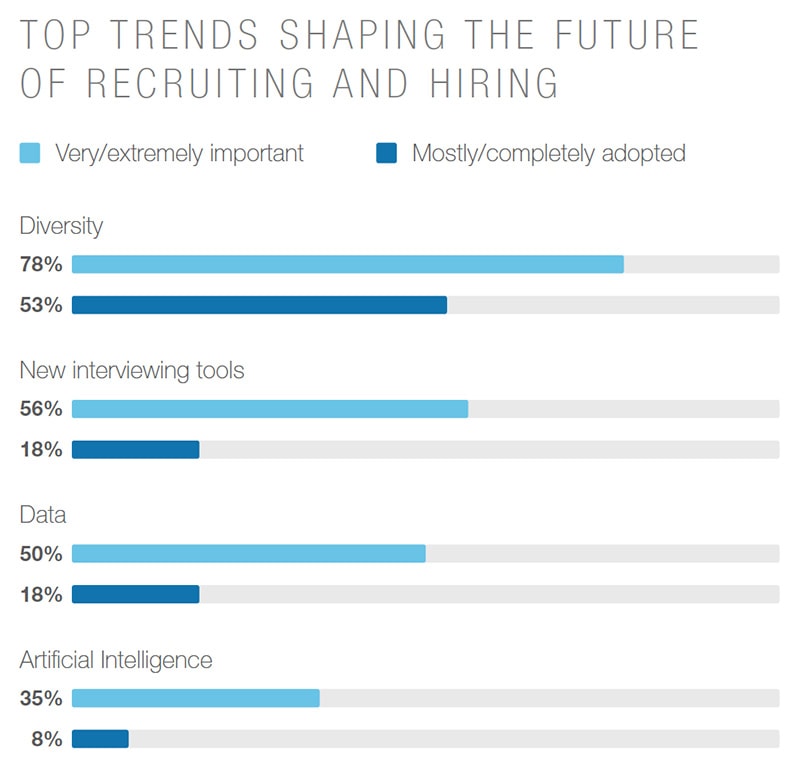
6. Diversity hiring is the most embraced trend with 78% of talent leaders wishing to tackle hiring diverse talent, head on. (LinkedIn)
7. Top trends shaping the future of recruiting and hiring are diversity (78%), new interviewing tools (58%), data (50%), and artificial intelligence (35%). (LinkedIn)
 8. According to Thomson Reuters, the most diverse and inclusive workplaces are Accenture PLC, Novartis AG, and Medtronic PLC. (Thomson Reuters)
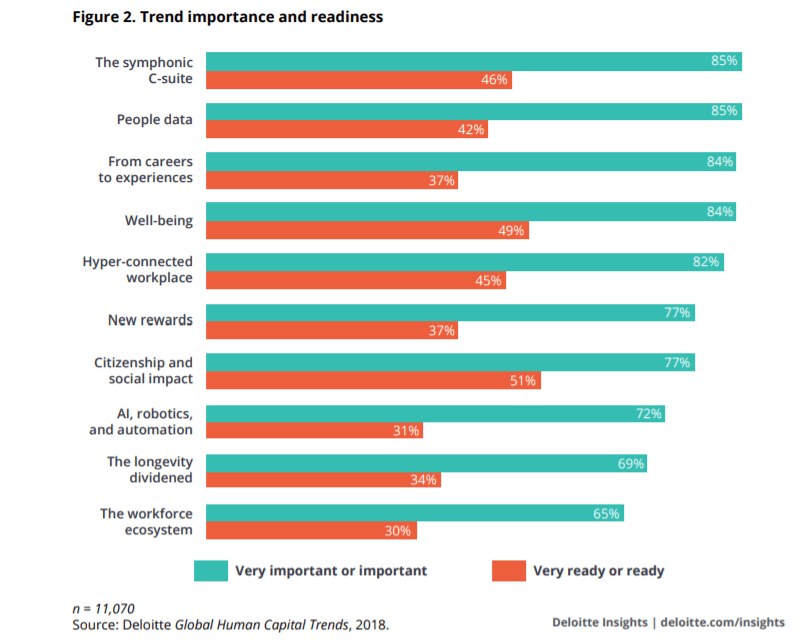
9. According to Deloitte, respondents agree that the symphonic C-suite where teams lead teams (85%), people data (85%), and the “from careers to experiences” notion (84%) are the most important trends in HR. Although organizations understand their importance, they are far from ready to meet the expectations. (Deloitte)
10. Racially diverse companies are 35% more likely to perform better than non-diverse ones. (McKinsey)
11. 92.7% of developers identify as men. (Stack Overflow)
12. In 2018, only 24 women (4.8%) were CEOs of Fortune 500 companies. (Catalyst.org)
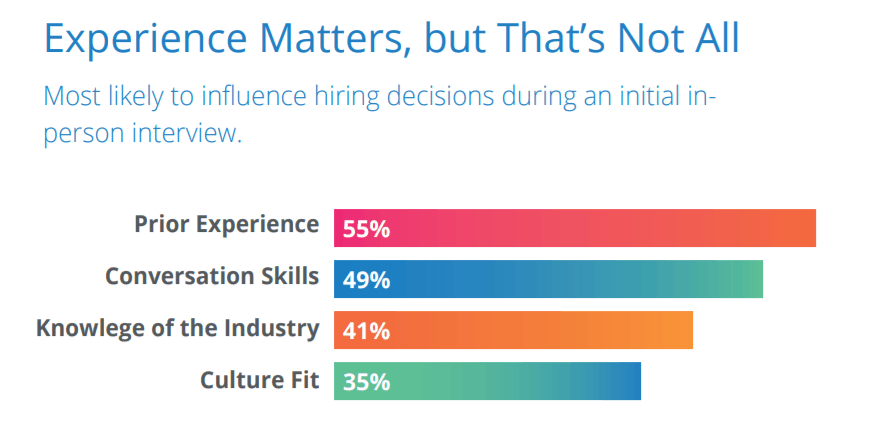
13. Prior experience, conversation skills, knowledge of the industry, and culture fit are the top factors likely to influence hiring decisions in in-person interviews. (Jobvite)
Candidate experience human resources statistics
14. 95% of respondents believe “that the way a potential employer treats them as a candidate is a reflection of how they would treat them as an employee.” (iCIMS Inc.)
15. Almost 3 out of 5 applicants abandon their online application due to bugs or issues with the careers site. (iCIMS Inc.)
16. 67% of employed Americans think that the application, interview, or offer process could make or break their decision on whether to take a job, according to a new report from (iCIMS Inc.)
17. Most applications are completed mid-week, with Tuesday and Wednesday 18%. (iCIMS Inc.)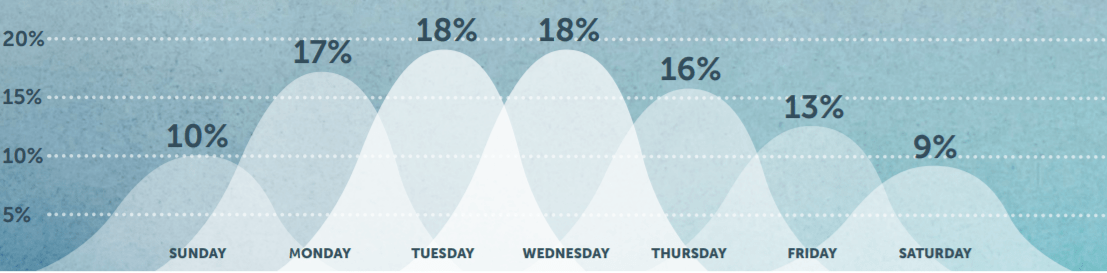
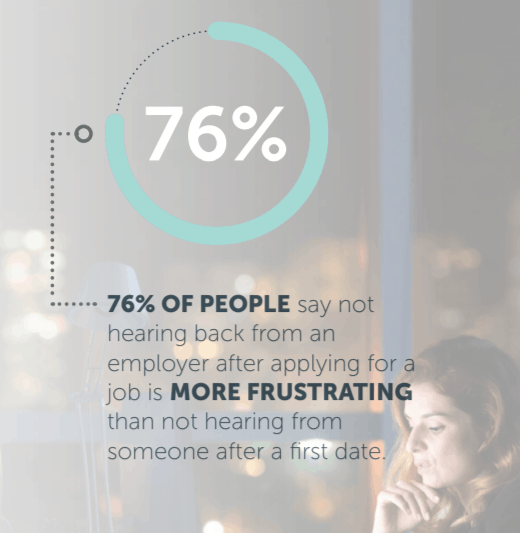
18. Communication is one of the key factors affecting the candidate experience. In fact, 76% state that not hearing back after applying is more frustrating after not hearing back after a first date. (iCIMS Inc.)
19. 69% of candidates use Google in their job search. (iCIMS Inc.)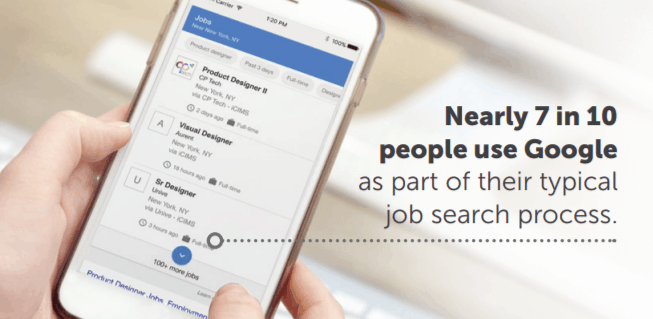
20. More candidates are now “ghosting” their jobs than ever. 20-50% of people bail on scheduled interviews or don’t show up for their first day of work. (USA Today)
Open roles and unemployment human resources statistics
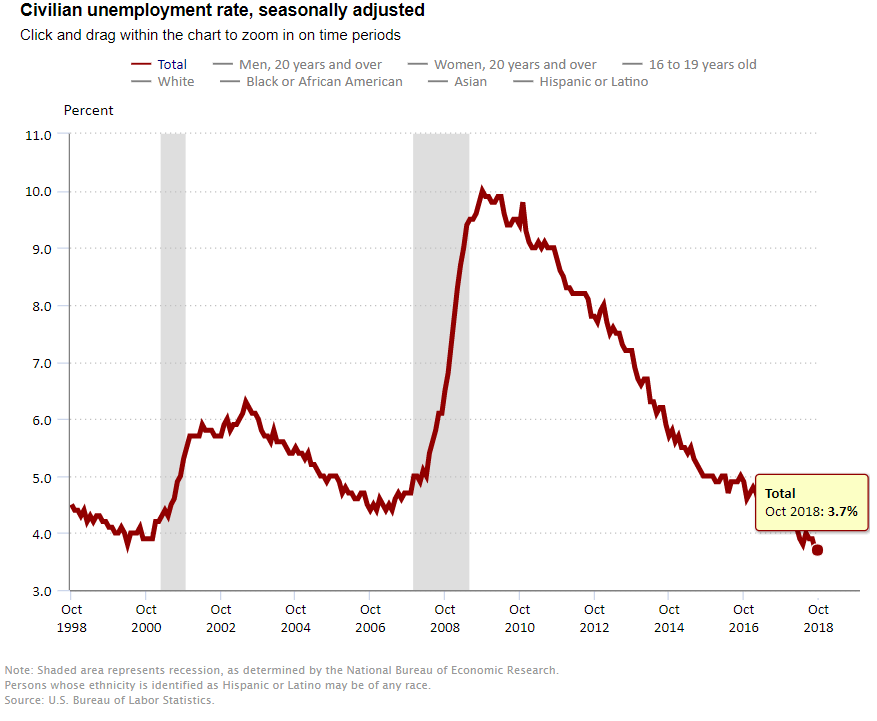
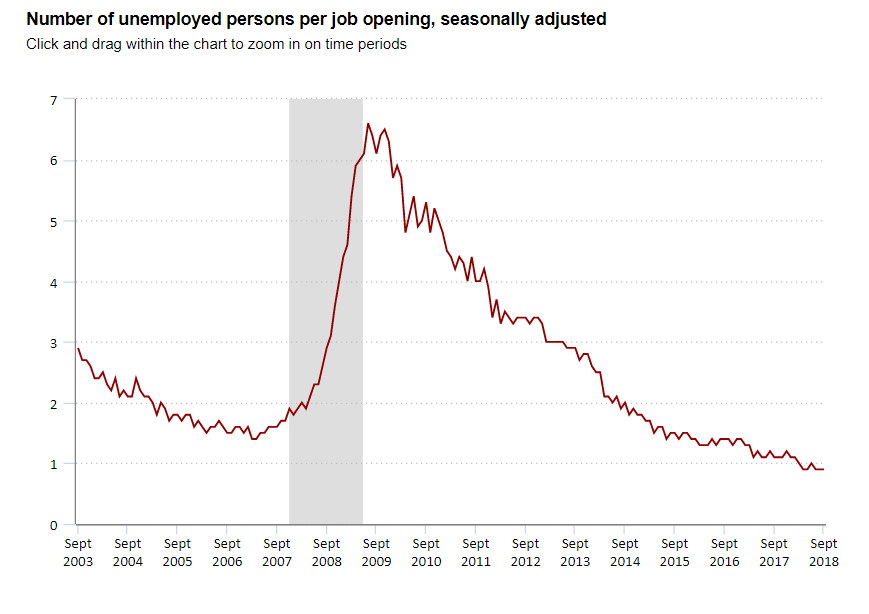
21. The U.S. unemployment is at its lowest in almost 18 years. (The Bureau of Labor Statistics)
22. There are more open jobs than unemployed people in the US. In the third quarter of 2018, there were 7 million job openings and 6.1 unemployed. (The Bureau of Labor Statistics)
23. Employees report positive hiring intentions in 43 out of 44 countries. (ManpowerGroup)
24. There was 0.9 unemployed person per job opening in the U.S. as of September 2018. (The Bureau of Labor Statistics)
25. Almost a third of employers claim the main reason they can’t fill roles is a lack of applicants. 27% think candidates lack the necessary hard and soft skills. (ManpowerGroup)
26. Filling roles is the hardest for large companies (250+ employees). They find it twice as difficult to fill roles than micro firms (with less than 10 employees) (ManpowerGroup)
27. That said, the percentage of small business owners with at least one unfilled job opening is at a 45-year long high. (NFIB)
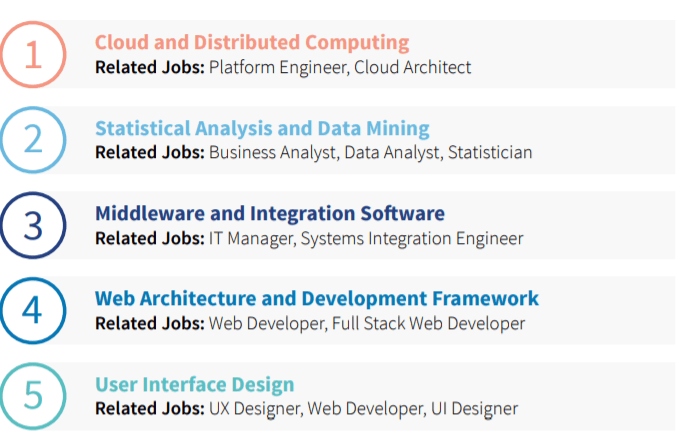
28. The top 5 hard skills companies were working the hardest to fill (with related job titles) are as follows: Cloud and distributed computing, statistical analysis & data mining, middleware and integration software, web architecture and development framework, and user interface design. (LinkedIn)
29. The hardest roles to fill based on hard skills include Platform Engineers, Cloud Architects, Business Analysts, Data Analysts, Statisticians, IT Managers, Systems Integration Engineers, Web Developers, Full Stack Web Developers, UX Designers, and UI Designers. (LinkedIn)
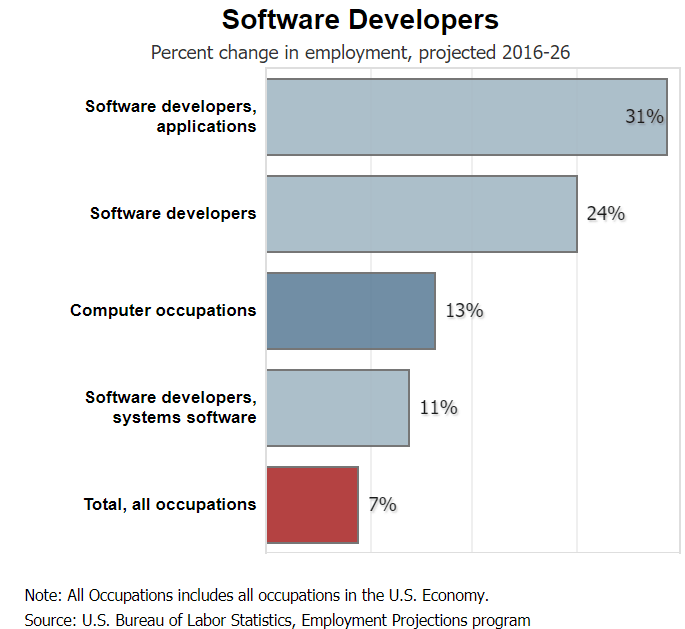
30. “Employment of software developers is projected to grow 24 percent from 2016 to 2026, much faster than the average for all occupations.” (The Bureau of Labor Statistics)
 Job satisfaction and autonomy human resources statistics
31. 64% of workers globally feel their job gives them a sense of meaning and purpose. (DecisionWise via Human Resources Today)
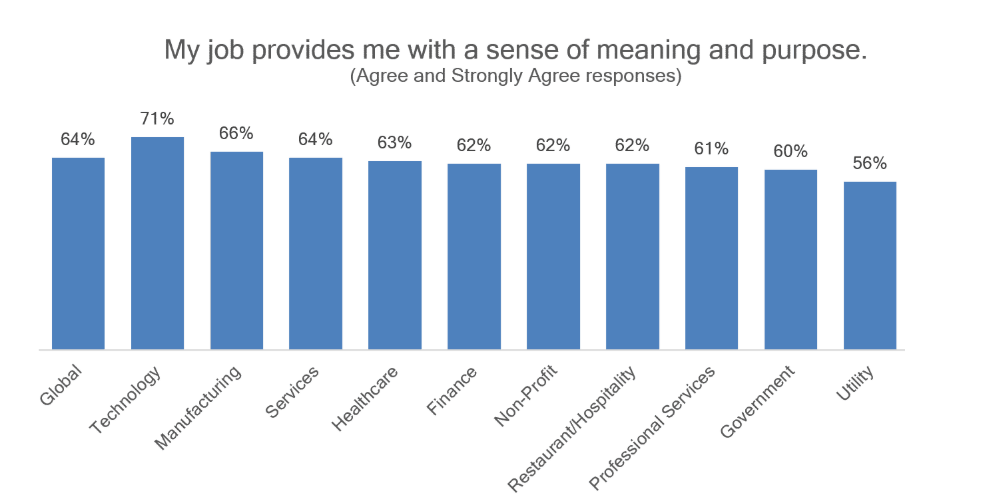
32. Tech workers have the strongest sense of meaning and purpose. (DecisionWise via Human Resources Today)
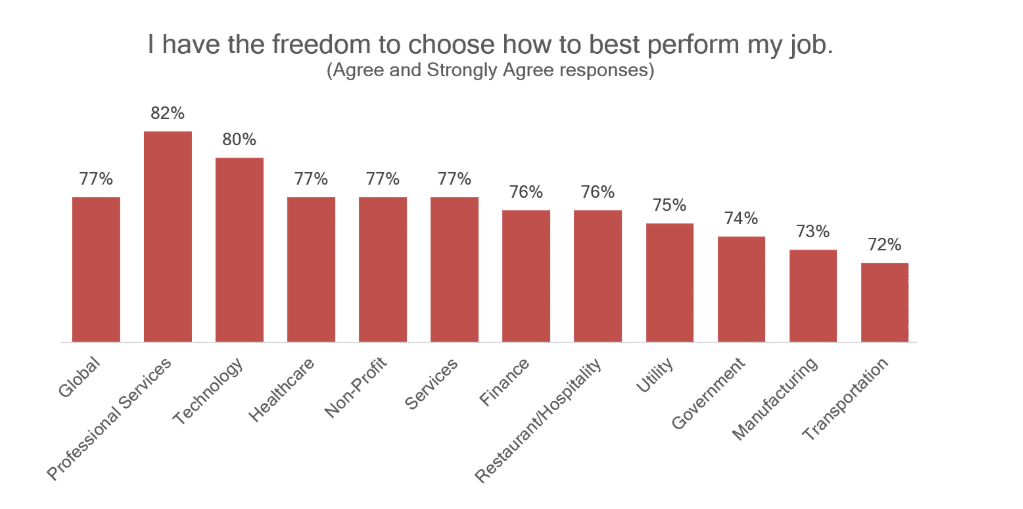
33. 77% of workers globally feel they have the freedom to chose how to best perform their job. (DecisionWise via Human Resources Today)
34. Tech workers are the second biggest occupational group experiencing the most autonomy. (DecisionWise via Human Resources Today)
AI and Automation human resources statistics
35. 76% of recruiters and hiring managers say AI will be at least somewhat significant in the years to come. (LinkedIn)
36. “Almost all surveyed recruiters have an either positive (49%) or indifferent (42%) attitude when it comes to automation/AI in respect to their own jobs.” (Jobvite)
37. Recruiters aren’t afraid of automation taking over their job. Over half of the surveyed recruitment professionals think no one in their company is going to be displaced in the next three years due to AI and automation (55%). (Jobvite)
38. The biggest benefit of AI in hiring is saving time (76%), removing human bias (43%), delivering best candidate matches (31%), and saving money (30%). (LinkedIn)
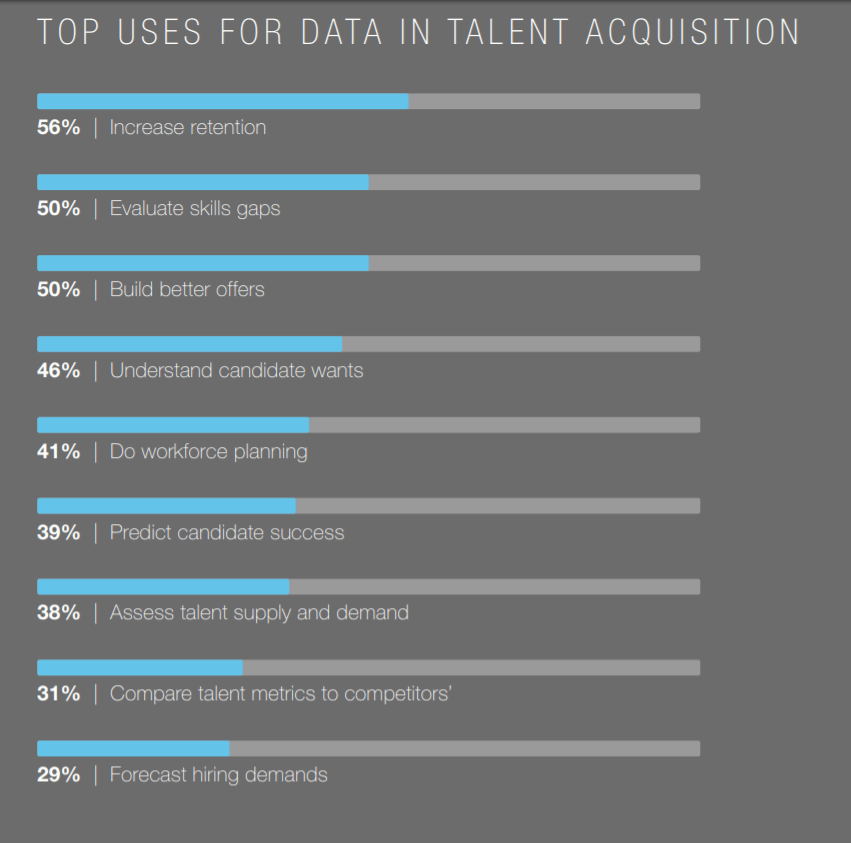
39. Most talent acquisition professionals use data to increase retention (59%), evaluate skill gaps (50%), and build better offers (50%). (LinkedIn)
Changing jobs & employee tenure
40. More than half of employees (51%) are searching for new jobs or watching for openings. (Gallup)
41. Most employees leave because they’re looking for a better company culture. (Glassdoor)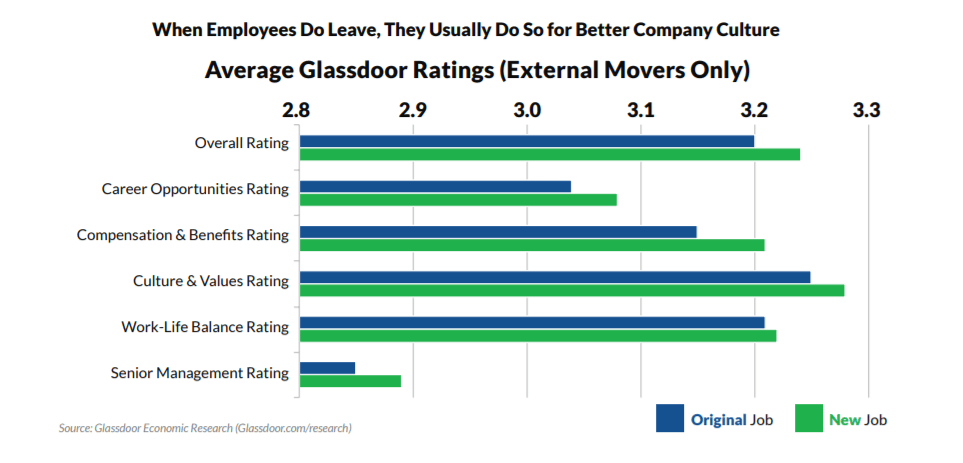
42. According to Jobvite, most people (19%) left their jobs for compensation reasons. (Jobvite)
43. 30% of people have left a job within the first 90 days, mostly because the role was not what they expected. (Jobvite)
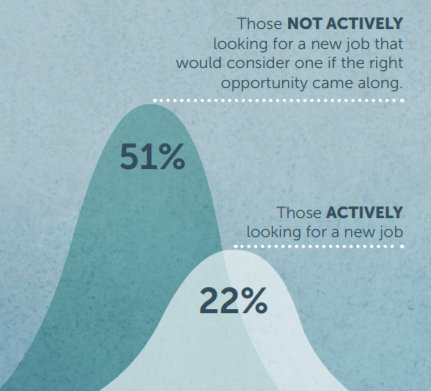
44. “Today, only 22% of those surveyed are actively looking for a new job, but 51% said even though they are not actively looking for a different job, they would consider one if the right opportunity came along.”(iCIMS Inc.)
 45. Tech has the highest turnover rate of all sectors (13.2%). (LinkedIn)
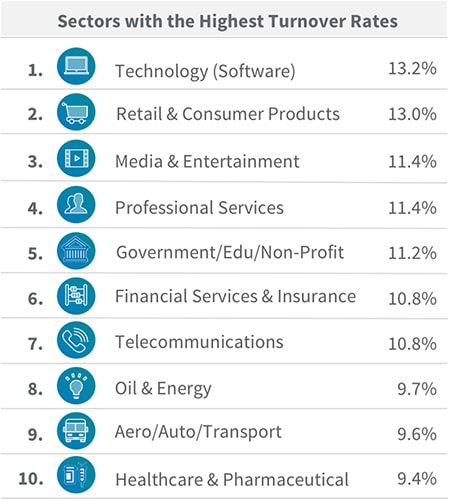
46. The average tenure for Silicon Valley companies: Uber 1.8 years, Dropbox 2.1 years, Tesla 2.1 years, Tesla 2.1 years, Square 2.3 years, Facebook 2.5 years, Airbnb 2.6 years, Box 2.7 years, Netflix 3.1 years, Salesforce 3.3 years, Apple 5 years, Oracle 7 years, Cisco 7.8 years. (Business Insider)
47. 68% of employees think they are overqualified for their current job. (Gallup)
48 35% of people have changed jobs in the last three years. (Gallup)
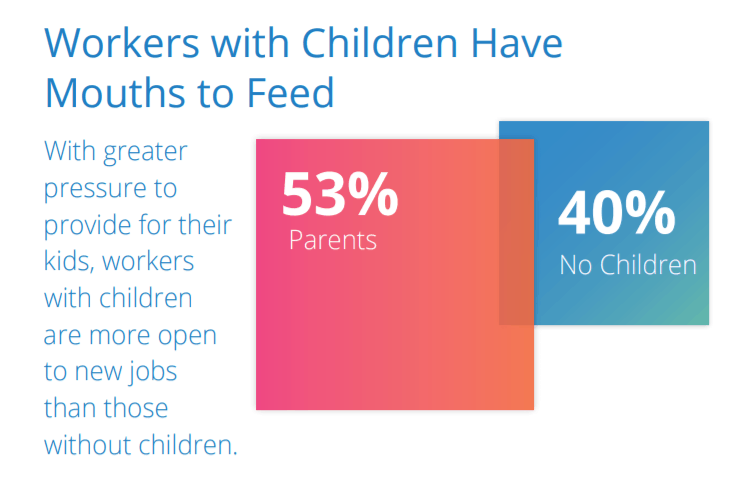
49. Married job seekers change jobs less frequently than non-married ones. Interestingly though, people who have children are more open to new jobs. (Jobvite)
 50. More than a quarter of candidates weren’t looking for a job when they last changed jobs. (iCIMS Inc.)
51. The median employee tenure for all occupations in the U.S. reached 4.2 years in January 2018. (The Bureau of Labor Statistics)
52. 26% of employees quit their jobs because they haven’t been onboarded or trained properly. (iCIMS Inc.)
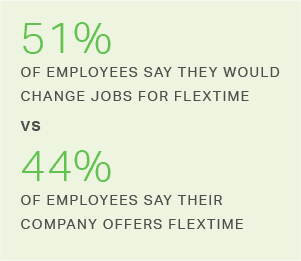
53. 51% of employees would change jobs for one with flexible working hours but only 44% of employers offer flextime. (Gallup)
54. The “interview” is the most commonly used word by developers to describe the exhausting part of the job searching process. (Stack Overflow)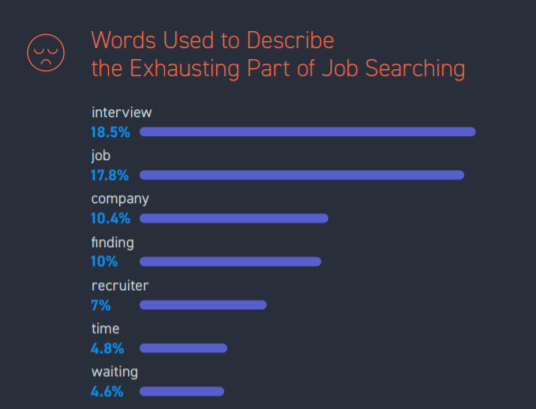
Human resources statistics for salary, compensation, and perks
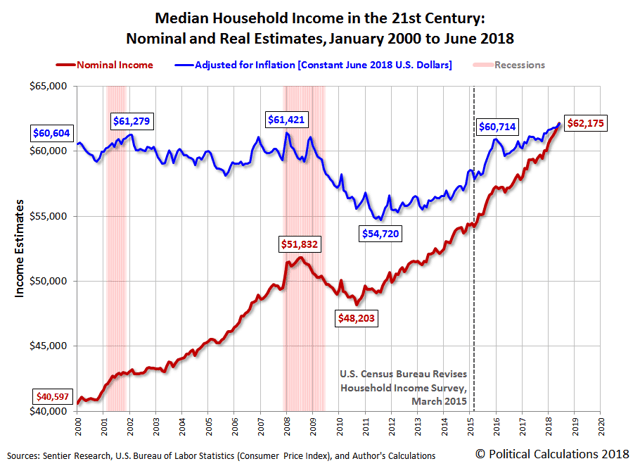
55. 2018 median household income in June 2018 was $62,175. (Sentier Research)
56. In the U. S., women earn on average $0.81 to every $1 earned by men in 2017 (81%) for annual earnings. (United States Census Bureau)
57. 32% of people are willing to take a 10% pay cut for better company culture. (Jobvite)
58. According to PayScale, the median pay of recruiters is $48,463. (PayScale)
59. According to the Bureau of Labor Statistics, Human Resources Specialists make on average $60,350 annually. (The Bureau of Labor Statistics)
60. “Employment of human resources specialists is projected to grow 7 percent from 2016 to 2026, about as fast as the average for all occupations.” (The Bureau of Labor Statistics)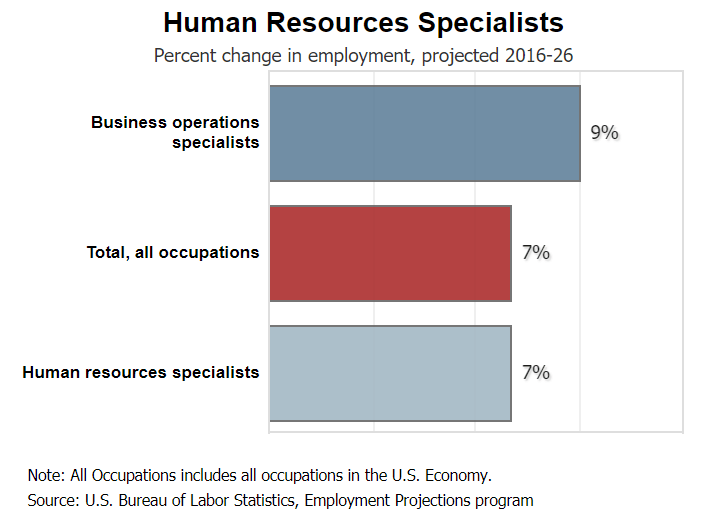
61. The 2017 median pay of software developers is $103,560 per year or $49.79 per hour. (The Bureau of Labor Statistics)
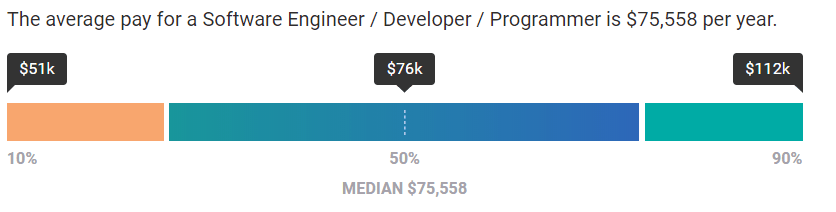
62. According to PayScale data, software engineers make $75,558 per year. (PayScale)
63. $2,146.61 – the total annual loss of income due to missed shifts by employees in the United States (average based on their pay rate). (Ximble)
64. 27 absences – on average per employee, per year. (Statistical sample of 171,621 clock-in records, 398 companies, and 5,794 different employees, where all shift durations ≤ 8h.) (Ximble)
Recruitment KPIs
65. 1 out of 8 applicants will now get an interview. (Jobvite)
66. The average top-to-bottom funnel efficiency is 0.37%. (Jobvite)
67. The average Time to Hire is now 38 days, as compared to 39 days in 2016. (Jobvite)
68. According to DHI Hiring Indicators, mean vacancy duration in April 2018 rose to a record high of 31.1 days. (DHI Hiring Indicators)
69. Companies typically make an offer for every 3.5 people they interview. (Jobvite)
70. 9 out of 10 offers get accepted. (Jobvite)
71. The percentage of interviews that result in offers increased significantly: from 19% in 2016 to 28% in 2017. (Jobvite)
72. 83% of customers using ATS software said they are likely to recommend it to other professionals. (G2 ATS grid)
73. The estimated average ROI of ATS software rated on G2 is 14 months. (G2 ATS grid)
Learning and development human resources statistics
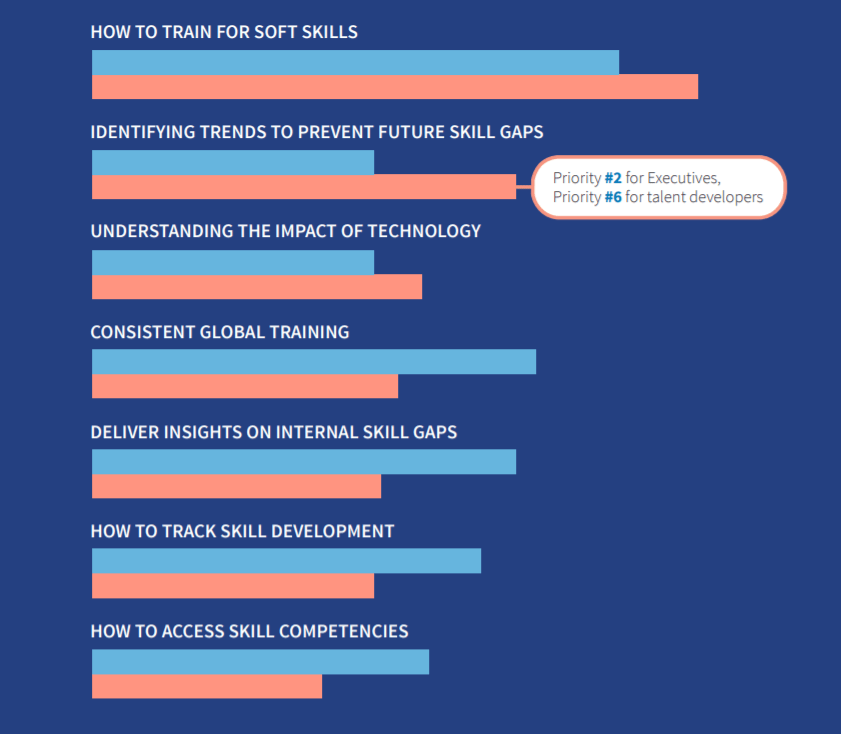
74. The #1 priority for learning and development is to train for soft skills to prepare the workforce for the impact of automation. (LinkedIn)
75. Top skills for employees to learn are leadership, communication, collaboration, role-specific skills, time management, and program or platform usage. (LinkedIn)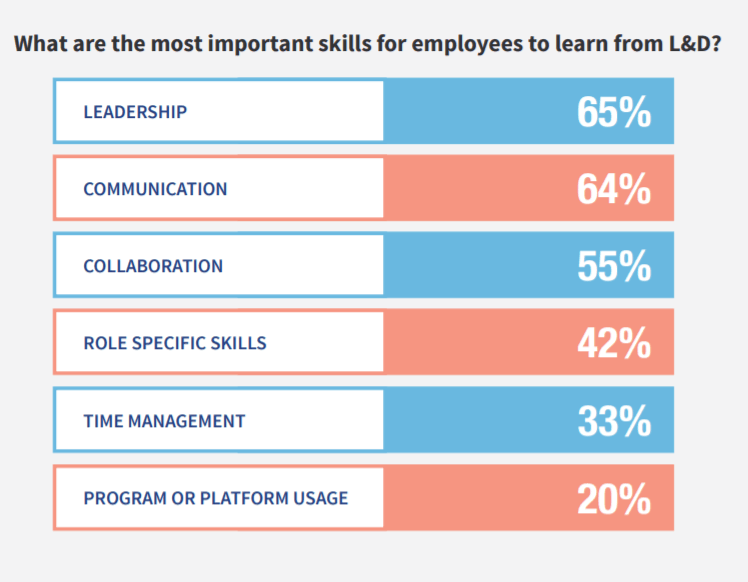
Talent retention and feedback statistics
76. 1 in 2 managers are thinking about leaving their company in the next 12 months. 7 in 10 say they feel undervalued and underpaid (Source: TalentLMS)
77. Top reasons managers stay at their current companies (besides compensation): the people they manage (61%), decision-making power (49%), work-life balance (44%). (Source: TalentLMS)
Human resources statistics: key takeaways
As a recruiter, it’s good to know the human resources stats which represent the current trends impacting the industry. This type of knowledge gives you the power to make informed decisions and understand whether you’re going in the right direction. As recruiters are struggling to find qualified, skilled candidates globally, this gives a lot of freedom to candidates. They are more likely to take risks, change jobs, and negotiate pay. Since the market is candidate-centric, company culture and candidate experience are more important than ever. If you want to hire great developers, you really need to keep up.
As a job seeker, knowing these human resources statistics can help you decide whether you want to make a job change in 2019 and what other candidates may be doing.
I strongly recommend the resources mentioned in this article if you want to have a full understanding of the subject. Are there any other statistics that you’d like to see on the list? Let me know in the comments section below!
Share post